On Monday, China stock market fell 3% because of fear of inadequate capitalization of major banks. Now it is fear of a debt default by Dubai.
There will be a flight to safety. But the challenge whether the market is going to move to dollar or to gold for safety or to both. I bet gold will ultimately win as market and central bankers realized it is a better refuge for a debt collapse in the market.
Looks like this morning action, gold is decoupling from the dollar. The dollar went up and gold went up too. The highest was 1195. This is a very important test of any potential change in the price of gold. If it holds, it could really go parabolic as shorts will be forced to cover the next few days.
Also, watch companies with high debt. They had a great time since March as most of these companies are able to raise funds through issuing capital. Among these are companies like CAL, SPG, MGM, GE ( yes GE!) etc where mounting debts could cripple the companies anytime.
Thursday, November 26, 2009
Wednesday, November 25, 2009
SPG - Synthetic Put and reversed collar
Fundamentals:
Simon Properties is the largest mall owner in America. It owns 320 mails and shopping centers across 41 states
It owes $18 billion ot banks and barely can cover half the interest on their debt every year.
One of the bearish signs earlier beginning of this year was that insiders sold more than $25 m worth of shares since Sept 2008.
Its real estate is valued at $19 billion consisting of mostly shopping malls. Against these assets, its has debts in excess of $20 billion. Its tangible net asset value is only $2.9b. Note that if the assets decline in price by 14%, its shareholders could be wiped out.
Long term debt / Equity is 3.93. P/E is 53.07. Sales Q/Q -1.14. EPS Q/Q –24.77%.
The company is a REIT company which requires them to pay out 90% of their earnings as dividends. SPG spent about $1b on dividends which was $200 more than the cash flow it earned.
Against these appalling fundamentals, why does the stock rises from 45.22 around May to 77.9 today.
The key reason is that they were able to raise some money from the re leveraging of companies with high debts since May this year.
SPG was able to raise $500m by selling stock at $31 per share and another equity offering for $800m @ $50 per share earlier this year. It diluted the shareholders value but the stock rallied because is has greatly improved its capital position.
REITs are able to use leverage to continue to operate at a capital deficit because real estate prices almost always go up. But if real estate price goes down, they will face big problems
I believe because of this SPG has rallied from $50 to $77.9 together with the general market. I have been watching this stock for the last few months and decide to go bearish today because the technical indicators are giving me a sell signal to go short.
The mortgage reset has started especially for commercial property. There will be bigger interest payment and more commercial estates are expected to collapse. So, I do not expect prices of real estate for commercials to rise.
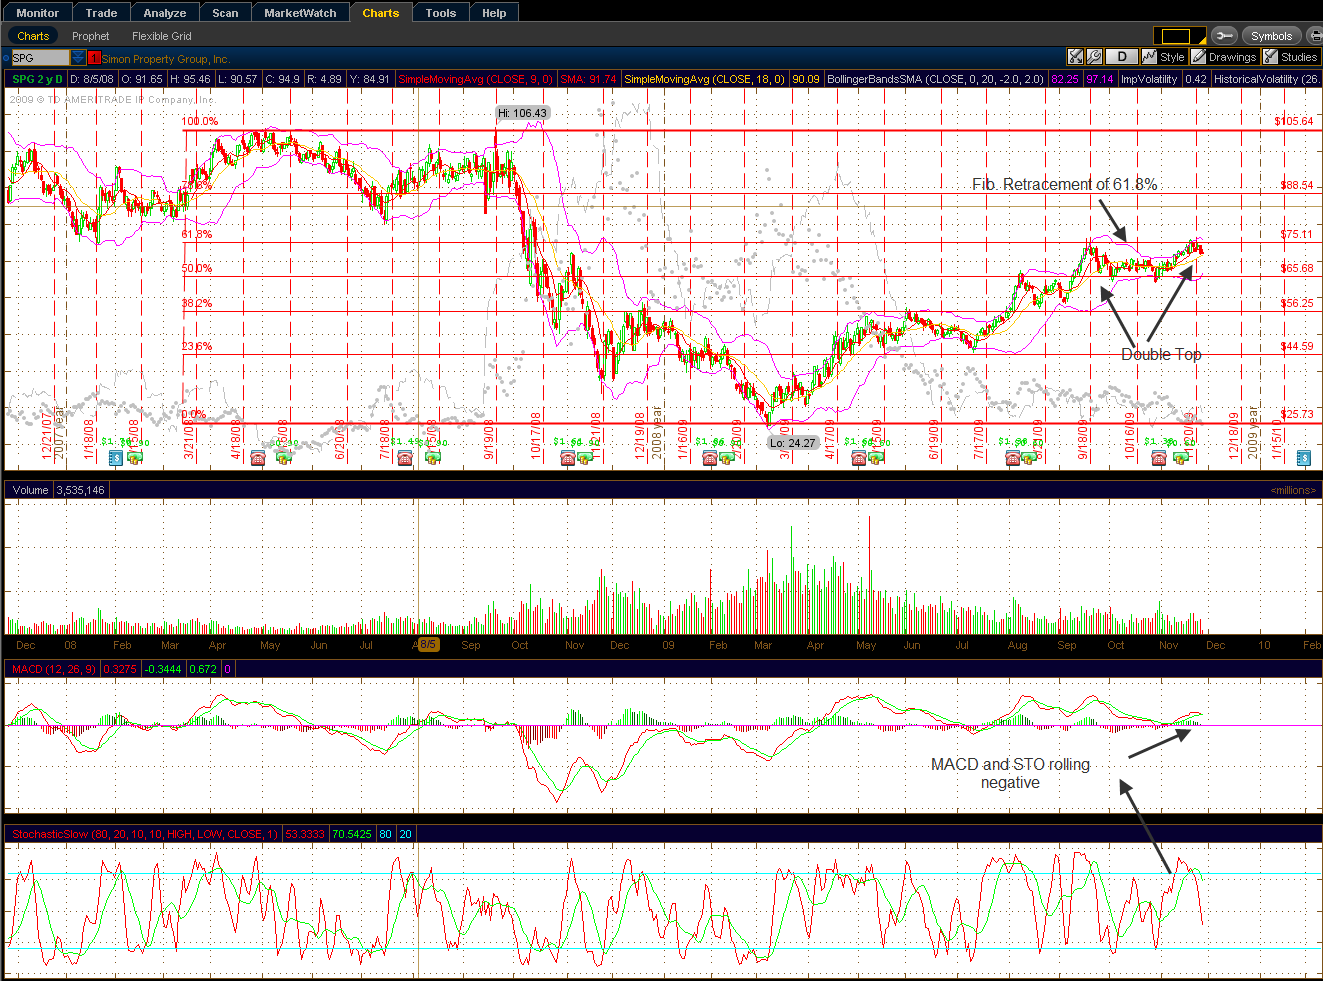
Technical
SPG has formed a double top ( see diagram )
SPG has also reached its 61.8% Fib. retracement and not able to move up further. Its weekly chart shows clear big loss of momentum since July 09. MACD is rolling over negative and STO are breaking down
Finally underlying fundamentals are catching up and the technicals are giving a leading signal.
The stock market has risen 65% from March 2009. Any correction will bring SPG easily down to 68 which is the next support
Trade:
Buy a synthetic put for SPG
· Sell short SPG at 77.9
· Buy a protective Jan call 80@ 1.35
Cost basis : 76.55
PE: This is not a long term trade as the seller has to pay dividends. We will close the trade by Jan when the stock hits below 70. Plan to close the trade at a ROI of about 15%
SE: Sell a SP to reduce cost if the stock breaks 80 and manage it as a reversed collar. Roll the protective call up by beginning Jan if the stock shows a bullish bias.
Monday, November 23, 2009
SLV - broken winged butterfly and call ratio backspread


Looking at the actions of gold last week, it is believed the bullish momentum will continue. Any corrections just intraday.
Since my GLD call ratio entered on Sept 09 expired last week with a profit of 300%, I decided to enter more trades on SLV and GLD.
Despite, the overbought situation, I believe we have entered scenario 2 and 3 outline in the previous post. Some of the momentum are certain the results the short squeeze by commercial traders. The trades below are suitable for prices that are overbought and the belief prices will go from high to higher highs. Instead of chasing the stock, it is structured that if the direction is wrong, we will lose little or make even a small credit.
1. SLV - Broken Wing butterfly
BTO Jan 18 Call / STO Jan 20 call - 2X / BTO Jan 21 Call for a debit of .6.
PE: Close the trade When when the ROI hits 200% or at > 1.8.
SE: I struggled with the SE. The first idea is to break down the trades into 2 - a bull call 21/20 and a bear call 20/21.
The bear call is an ITM trade. So credit is high and risk is minimal. It should be allowed to expire on its own. With the bull call, we will aim for maximum ROI of >25%.
So the SC is to be prepared to take a loss of .6 for 1 contract if SLV collapsed. In this case you will take the maximum risk of the bear call and the bull call. This is not a likely scenario given the current bullishness of the precious metal market. With this trade, time is on my side. If the trade stays >18.5 during Dec or at expiration, it will be a good trade. (see diagram )
If it goes up, it will be great trade.
If it collapse, I will take the maximum loss.
2. SLV Call backratio
STO Jan 17 Call / BTO Jan 20 calls - 2x for credit of .3
This trade requires SLV to move up or down. If it get stuck by expiration at 19, 5there will be a loss of 1.6. But if SLV drop below 17 by expiration, I will collect a credit of .3. If SLV goes in the direction expected, the profit is unlimited.
PE: If Silver continues to be bullish, hold on to the trade until end Dec where the time decay effects start to kick in and also if silver shows signs of a correction. Currently, it is overbought but the momentum is huge and thus silver could easily rise any 10-20% before correction. The ROI could be huge. Will exit the trade by end December if SLV shows signs it will slide back to 19-20.
SE: The reverse is true for this trade compared to the broken butterfly. Time is not on my side. The trade must move. It is similar to a straddle or strangle where time decay will kill the profit.
If SLV show signs of getting stuck in a range at 19 by beginning December, close the trade or convert to a calendar trade by sell SCs at a higher strike to the bullish side of the leg.
Friday, November 20, 2009
BG - synthetic collar by Joseph

This company in the agriculture sector, and its competitor is ADM.
Its fundamental is not the best,making money last quarter, but growth rate is negative.
This trade is based on technical indicators.
We have buy signals from MACD, RSI and 5ema and 20ema. It also crossed 200ma and 50ma on 11/18.
The volume on 11/18 is more than 2 times of average volume.
Support is around $55, and first resistance is $65 and second resistance $70.
Price was around $62 when I spot it because the volume of its DEC 65 call was usually high (open int 2500, volume 6219). Jan 70 call volume is also high.
It indicates that the expectation is for the stock to go up.
Trade selection: This is bullish trade. I could have chosen bull call calendar (BTO April 10 strike 65, and STO Dec 09 strike 70) delta is 31.
But I chose a trade with higher delta since is a short term momentum trade:
STO Jan 60 put at 2.87
BTO Jan 55 put at 1.35
BTO Jan 70 call. at 1.45
==================
Delta: 43
Net credit $0.07
Maximum risk : $4.93
Maximum profit: unlimited.
Break even $60.
Primary exit: Close half to 2/3 positions at $65.Let the rest run.
Secondary exit: If the price is slightly below break even, short call first (synthetic covered call).
If too bearish, long put also. so it will becomes synthetic collar.
Tuesday, November 17, 2009
RIMM - Bear Call

I made another contrarian trade today. Most people expect RIMM to go up. There are rumors of MSFT buyout and the company is buying back $1.2 billion dollars of their shares.
I am not optimistic shorter term on RIMM primarily from the technicals.I am not bearish longer term. Thus, I am willing to collar the stock if my SC goes ITM.
RIMM is having a Head and shoulder with the neckline at 60-65. If it breaks 60, it could go down to <50. So far,the actions in the last few days were not positive.
So I decided to go for a Bear Call
o BT0 65/70 Bear Call for a credit of 1.35.
PE: Let the short call expires and keep the credit by December
SE: The BE for the sale is 65+1.35 = 66.35. So if stock goes ITM at 65, I will either close the trade or buy the stock at around 66.35. I will be putting a stop limit order to buy the stock at 66.35.
If the order is triggered, the trade will be turned into a collar. Let the SC expires, roll the Long call 70 to Jan and buy a put in Jan or Feb stike 65. By that time, it is probably confirmed that RIMM has turned bullish if it breaks 65.
Monday, November 16, 2009
GLD - Ratio Spread


I just closed my GLD ratio call spread for a 100% ROI in 3 days. It may be too early but the profit is too tempting.
The charts above are my projections for gold. It touches 1135 as I write. I believe it will hit 1300 by March next year. Before that, there should be a small correction. Any move below 1100, I will be adding to my bull trades. This move is very strong and is not going to slow down soon.
The first chart gives 3 scenario on how gold price will move. Scenario 2 is the most probable scenario.
I also drafted out the Fib. Fan. It agrees with the projection on the first chart.
Below are some not so common arguments why I am bullish on Gold:
1. Central bankers are net buyer of Gold this year.
2. Many successful money managers are buying gold - David Einhorn, Paul Tudor Jones, and Jim Rogers
3. In Financial times last week, 2/3 of 100 respondents to a survey by the Family Office Channel said that the super rich are now more likely to invest in gold and other commodities
4. Total World bailout is about 19 Trillion dollars. All the gold ever mined now is about $5T dollars
5. 2008 Gold production is about $73 billion. Demand is far greater than supply now.
6. The market cap of all the gold minors is only about the same size as WMT. Oil and Gas industry is 12 times higher.
The panic has not started yet. Once it starts, gold price will be parabolic. The fact that gold has exceeded the pre-bust high in 2008, should be a monumental indication we are headed high.
As I said, there should be a short correction. Once there, I will load up again to my current positions which is already sizeable.
Friday, November 13, 2009
How to overcome situation when you make a major mistake in your trade and is caught in the wrong direction?
Below is an interesting recent case study on RIMM. The drop on end September caught a lot of people by surprise. Overall the market is bullish and one may get complacent and made some silly mistakes like forgetting to put a protective put before earnings.
Sept 24th 2009

Bought an ITM covered Call
· BTO 100 stock at 83.16
· STO SC Oct 75 at 10.10
Cost Basis: 73.06
Reward: 1.94 or 2.65 %
Made a major mistake. Earnings was on 9/25 and the position was not protected!
Sept 25th 2009

Earnings disappointed and price dropped 17% to around 69.3
Steps taken:
1. Roll the SC down from Oct 75 to Dec 70
· BTC Oct 75 Call for 1.15
· STO Dec 70 Call for 5.9
New Cost basis: 73.06 +1.15 – 5.9 = 68.31
Note that the cost is already below the closing price after the drop.
Next decision was to buy a put to make it a collar. There was hesitation because of the IV, the price of put was expensive. Nevertheless, since there is a major change in the sentiment for this stock, a put was added
2. BTO Dec 65 Put for 2.92
Note the put is bought OTM. Trying to keep the CB low.
New Cost basis: 71.23
3. Cost average down by buying another ITM Covered Call
BTO 100 stock at 68.85
STO Oct 65 SC for 5.66
Cost basis: 63.19
Potential Reward: 1.53
( Similar cost reduction could be done with another BULL PUT or even call calendars if you are familiar with the trade )
Oct 14th 2009

RIMM stabilized and the SC expired. Booked profit from ITM CC = 1.47
New Cost Basis: 71.23 – 1.47= 69.76
Oct 30th 2009

Stock continued to go down.
November put running out of time. It was end of October
Decided to roll the PP out and down.
· STC Nov 65 put for 6.61
· BTO Dec 60 put for 5.21
New Cost Basis: 69.76 – 6.61 +5.21 = 68.36 ( Cost is reduced slightly from credit of rolling down the put )
Nov 6th 2009

It was a difficult decision. On one hand, RIMM seemed to have some support at 60. But on the other hand, looking at it, there could be a potential head and shoulder. If RIMM dropped below 60, it could go easily to <50.
Nevertheless, it was decided to remove the put and make it a covered call again. It could be a wrong decision but a put can always be added back if it drop.
· STC Nov 60 put on Nov 6 for 5.35
Also, roll the SC down from Dec 70 to Dec 60
· BTC Dec 70 SC for 1.08
· STO DEC 60 SC for 3.66
New Cost Basis: 68.36-5.35+1.08-3.66 = 60.43
Add another ITM Covered call to reduce cost
· BTO 100 shares of RIMM at 58.01
· STO Dec 50 SC for 9.54
· Cost Basis = 58.01 –9.54 = 48.47
Note that a bull put can be used also to reduce the cost. If a bull put is used, one needs to be ready to take the share and collar it the SP goes ITM and converts it into a collar
So if the stock remains above 60 on expiration, the profit for this trade is:
200 shares * (60-60.43 ) = -0.86
100 shares * ( 50 – 48.47) = 1.83
Thus there is still a small profit of 1.03 if stock stays above 60 by Dec option expiration.
Nov 13th 2009 - Concluding Remarks
Today, the stock is trading at 62.69. It has not turned bullish although there were rumours that MSFT may buy out the company. So there was a rally yesterday. There is strong resistance at 65 which is the last gap down.
The stock could easily goes back down, breaks support at 60 and go down to 50 just as I indicated with the longer term Head and Shoulder pattern above.
If that is the case, more adjustments will be needed.
The process is similar. The key is to keep a constant vigilance to protect your cost basis. Find the right opportunity to ride the trend up when it reaches support. For a fundamentally sound stock like RIMM, it will get back again one day.
There are more aggressive plays to manage a collar like this. You can sell the puts when the stock goes down and convert to shares to average down without adding cost. Be sure to add a new protective put for the new total number of shares. You can buy more shares at the perceived bottom and add PP. But these are more risky moves as you may be catching a falling knife.
My preferred way is to manage and close it breakeven or with a slight profit. After that, I will enter a new trade if the conditions are right
Meanwhile, keep managing and hope to spot the right opportunity to ride it back up again. While doing so, ensure that cost is under control.
ANF Bull put by Joseph

ANF reports earnings today. It beats expectation, and expected to be profitable in the next 4-6 quarters by analysts.
Stock gapped up this morning now at $40.
STO Nov 39 put 0.55
BTO Nov 35 put at 0.05
=====================
Net Credit 0.5
Max Risk: 4 - 0.5 = 3.5
ROR = 0.5/3.5 = 14% in 7 days.
BE: $38.5
PE: let both options expired worthless.
SE: Accept assignment at cost base $38.5. Turn into covered call/collar trade.
Monday, November 9, 2009
Calendar trades by Ted
This has been a break-out day for calendar trades. Here are my trades today with fill price:
ADBE 36.21 April 36 LC Dec 38 SC 2.55
FCX 83.57 May 85 LC Dec 85 SC 6.85
CAT 60 May 60 LC Dec 65 SC 5.7
WLT 67.46 Mar 65 LC Dec 70 SC 6.9
MEE 34.32 Apr 34 LC Dec 36 SC 3.5
PE for each of these is 25% ROI. Check the charts on these.
ADBE 36.21 April 36 LC Dec 38 SC 2.55
FCX 83.57 May 85 LC Dec 85 SC 6.85
CAT 60 May 60 LC Dec 65 SC 5.7
WLT 67.46 Mar 65 LC Dec 70 SC 6.9
MEE 34.32 Apr 34 LC Dec 36 SC 3.5
PE for each of these is 25% ROI. Check the charts on these.
Sunday, November 8, 2009
REXX - additional analysis by Joseph

Rexx setup looks good.
Please see attached chart. It is my attempt to put Elliott wave number on the chart.
Friday, November 6, 2009
REXX - Covered Call

Fundamentals:

.Longer term I am bullish on oil. US$ has to go down and oil has to go up.
IEA senior claims the US has played an influential role in encouraging the watchdog to underplay the rate of decline from existing oil fields while overplaying the chances of finding new reserves.
The allegations raise serious questions about the accuracy of the organisation's latest World Energy Outlook on oil demand and supply published on Nov 9th – which is used by the British and many other governments to help guide their wider energy and climate change policies.
· This is a semi speculative trade. It is speculative because it is a small company. I am bullish on oil over the next few months although I expect short term there will be some correction from current level of $79 per barrel to around $70. It is my intent to load up on oil companies once the oil price reaches close to this level
· But I cannot resist doing a covered call for this company when I saw the high premium it offers on the SC.
· REXX us $240m market cap company based in Illinois Basin ( 72% oil, 27% Natural gas and 1% natural gas liquid)
· It has $24m in cash and $17 m long term debt which is healthy for a small size company
· REXX belongs to the group of oil companies where the initial potentials of easy production is over. There is still 60-70% of oil trapped in the ground in these “depleted” oil field. Sophisticated enhanced oil recovery techniques can be used to recover another 25% of the original oil in place.
· With oil above $70, it is now viable to recover this oil again. Cost of recovery is around $25 per barrel. It is still cheaper than the cost of tar sand oil in Canada.
· So far the market has not recognized the value of the potential of recovery using newer techniques. The potentials are placed under “reserved”. The oil is definitely in existence. It has been there for years. It is a matter of time that the reserves will be “proven”. Once proven, price of stock can double.
· REXX released its results yesterday after being delayed for 1 day. It was a lower loss and better than analysts’ expectation.
· The company is resuming its oil recovery activities as oil prices resume its upside trend. As long as oil price hold above $50 per barrel, company can deliver good potentials for the coming months.
Trade – covered call
BTO 1000 shares at 8.98
STO 2010 March 10 SC at 1.25
Cost Basis: 7.73
Maximum Return: 2.1 or 27.2 % ( 81% annualised )
PE: Let the SC expired or assigned. If expired, continue to short call against stock. The stock has a potential to double in the coming months
SE: Add a protective put if it is below 7.5 to turn it into collar.
HTS - ITM covered call

Fundamental
- HTS borrows money at a low interest rate and invests it at a higher interest rate in an iron-clad safe, government-guaranteed bonds. It earns the difference – the "spread.". It is a virtual bank. A similar business is NLY – Annaly Capital. NLY is 9 X bigger.
- I like the business model. And when it's in its sweet spot, it makes a fortune. It is invested not toxic waste debt but government guaranteed bonds, just like treasuries.
- Recent financial statement shows that HTS borrowed money at 2% and invested it with no credit-risk at 5%. So it earned a 3% spread. With 8 times leverages – 3% spread becomes 24%. Most bank use much higher than 8X leverage.
- There is very little overheads. Thus Operating Margin is equal to Profit Margin equals to a hefty 54.35% Cash to share is a healthy 4.77. It is 71.6 % owned by institution.
- Interest rate is forecasted not to go up. It can invest the money at a higher rate. The Fed has maintained this week that it will not raise interest rate for near to mid term.
- Most attractive is that this company has a dividend yield of 18% annually.
Considerations:
- It is a longer term trade
- Company balance sheet must be solid enough to provide the dividends
- Goal is to capture the high dividend while controlling the risk. In this case, the risk is minimal. Probably of stock going below 24 is very low
Trade
BTO Stock 1000 at 28.8
STO 10 contracts May 2010 25 short call at 4.1
Cost basis: 24.7
Max Reward: 2.1 + 2.2 ( dividends for half year ) = 4.3 or 17.5 % or 35 % per annum
PE: This is an ITM covered call. Will allow the stock to be assigned.
SE: Stock long term support is clearly at 24. If stock goes down to this level, I will decide to add a put to make it a collar if the market is very bearish or just roll the call out in time if there is no real bearish factors for the stock to go a lot below this support.
A similar trade can be made for NLY which I have already some positions in my portfolio
I will consider to close the trade when the Fed is consider raising rates and take profit.
CPN - Covered Call

CPN is a power generation business. Instead of using coal, it is using natural gas as the energy source. It is the largest unregulated power generation company using natural gas – eliminate 99% of carbon based waste compared to coal fired plants
This is a green energy play. Currently, natural gas is still more expensive than coal. However, with the tax on carbon emission, it is expected that not only electric price will rise substantially.
Coal will be taxed heavily and thus CPN will become more competitive.
The company emerged from bankruptcy in Jan 2008. Current, it has $1.6b in cash, $7.5 b in current assets and another $11.9b in capital equipments and power plant.
Market cap is current 1.2 of book value.
The company has its gas price hedged till 2010. So a sudden increase in Natural gas price will not affect the company for next year.
Last 2 quarters earning reports show that they are gaining share and generate a free cash flow of about $520m. The company’s balance sheet is in good position
My target is that it will reach 2X of book value and equivalent to $18 per share. With the impact of carbon tax, the stock could even go up to $25.
Nevertheless, I am making a conservative trade with all the odds on my side.
BTO 1000 stocks at 10.15
STO 10 DEC 12.5 SC at 0.35
Cost Basis : 9.8
Max Income: 2.7 or 27.55% in 2 months. ( I am bullish on the stock )
PE: Let the SC expired or stock assigned. I will continue to short call as long as it is not assigned as stock has the target of reaching $18.
SE: If stock drops below 10 which is a clear support, may roll down the SC or add a put and turn it into a collar.
Wednesday, November 4, 2009
Car - New Calendar trade by Joseph

Fundamental:
1. Earnings report on Nov 2, 2009, AMC. Better than expected. Shares up today.
2. This is not a company with “solid” fundamental. However, all its competitors are in similar situation.
Technical: Current price 9.4.
Support around $8
First resistance at $10, Second resistance at 11.5 (50MA)
MACD tilt up, RSI up, coming out of oversold area.
Trade:
BTO Feb 2010 Strike 7.5 Call at 2.85
STO Nov 2009 Strike 10 Call at 0.55
Net debit $2.30 Maximum Risk : $2.30
Break even $8.79
Delta 32.9 , Theta 1.63, Gamma -12.18, Vega 0.77
Expectation: Price is between $10 and $10.50 at Nov 2009 expiration
PE: 20-25% ROI
SE: Bearish roll down SC to Dec 2009 strike 7.5.
Tuesday, November 3, 2009
Interesting tests on Strangle - Straddes before earnings

Straddles and Strangles are delta neutral and speculative trades. They are expensive but can be very profitable if structured correctly with the right timing and considerations.
I have been testing on straddles and strangles. Recently I tested it on a very volatile stock that normally moves a lot during earnings. – FSLR. The results were very interesting!
Considerations:
· Trade were placed one week before earnings where IV was reasonably low.
· Bollinger band was narrow and stock was trading at a narrow range – a low ATR
· It was 1 week before earnings
· When choosing the strangles, I tried to find trades where the delta were balanced i.e. the delta of put should be roughly equal to the delta of call
· I placed 4 kinds of trades
1. A longer term call and a short term put : bullish bias calendar strangle
2. A longer term put and a short term call: bearish bias calendar strangle
3. A short term straddle of 30 days
4. A longer term straddle of 95 days
As seen from the results above, the following observations are made:
· The best ROI is a short term straddle.
· IV increased made both the put and call profitable without movement of the stock. Stock price was around 152 on Oct 28th. When I placed the trades, the stock price on Oct 21st, the stock price was around 152.5.
· Even the stock gapped down, return of the bearish bias diagonal calendar strangle was only marginally higher than the bullish diagonal calendar strangle.
· The cheapest trade was the short term straddle and thus it gives the best ROI. As long as the stock moves, it makes the most money. It also makes most money in absolute value.
This may be contrary to the idea that straddle must be placed a little way out in time to minimize theta decay. The gamma, VEGA and IV effects more than compensate the theta decay. Also, this trade is meant to be a short term trade and thus may not be necessary need longer time. Unless you need more time for the trade to work, it is not necessary to place a longer term straddle.
Monday, November 2, 2009
IBM Put calendar - by Albert
Below is a trade by Albert. This is the first time he is placing a trade. Please comment.

BTO Jan10 (74dys) 120 Put@5.75 (may be changed when filled)
STO Nov09 (18dys) 120 Put@2.64 (may be changed when filled)
Net Debit / Cost Basis / Max Risk 3.02
Max Gain : around 206/302 = 68% in 18 days;
To achieve 20% Gain:
- 116.8(3.1% drop) < Stk range < 123.3 (2.3% rise)
BE right limit : 125.15 PE : Hold till Nov09 exp in 18dys
BE left limit : 115.25 SE : if stk to $124, roll up SC to OTM Dec09
Success Prob (according to TOS) : 44.9%
if stk to $116, roll down SC to OTM Dec09 & add DITM LP for neccessary period
Subscribe to:
Posts (Atom)


