Monday, September 26, 2011

VXX - volatility trade one more time (Updated - Sept 27)

 ( This is the third time I am trying to catch the top of the volatility the last 2 months.

The way I did it the last time was to short the stock and sell a put against it.

It is a trade with minimum risk and reasonable profitable - making about 2-4% in 4-8 days.

The reason for this kind of profit is the high volatility.

I did another one of these trades today.


Trade:

STO 500 shares of VXX = 49.4
STO Sept 51 SP = 3.16

This is ITM covered put trade.

Stock can go up to 52.46 at the end of this week  before losing money.

Technically, the trade is peaking and that is where I entered the short trade.

ROI = 3.15 % in 5 days


Update - Sept 27th

This is meant to be a very short term trade.

Since I got 75% of the targeted profit in 1 day, I decide to close the trade instead of waiting another 4 days.

BTC 500 shares 46.4
BTC Sept 51 SP for 5.05

Friday, September 23, 2011

Gold updates

There was a huge correction in gold for the last 2 days. It dropped about 18%. I kind of expected in as mentioned in my last update on September 8th.

But I was caught by surprise that gold and silver miners are brought down together with stocks.

I suffered some damage on my portfolio despite the fact that it is heavily hedged. I also have shorts for 12 positions for other stocks on the general market but my gold portfolio suffered.

So where do we go from here?

In this post, I shall revisit the fundamentals and list down my strategies to deal with this downfall.

For the time being, I am knock down but not knock out.
Most of my positions are hedged except for junior miners which had been hit hard. I even cut back some positions today but add more PHYS – which is for physical gold and silver.

Fundamentals.

I trade mainly on fundamentals. I use options only for hedging and technical for short term entry and exits.

To me the fundamentals have not changed. Lets do the analysis by asking a few questions.

1. Have the countries around the world stopped printing money?

How will Europe and the world deal with the current crisis? The direction is clearly to print more money.

Greece default is probably built into the market. But what about Italy, Spain and Portugal. Germany is the only nation in European Union that has a sound balance sheet but can it sustain the all the EU countries?

The Fed did an operational twist in the market this week. Instead it turns out to be a hurricane in the market.  DOW dropped more 300 points for 2 consecutive days!

For those that expected QE 3, this is some kind of QE 3 – the attempt to keep interest rates low and close to zero.

Here is an interesting chart from Casey Research.

To keep interest rates low from 2009 to 2010, it took $2T.  With extrapolation, it will take another $2T to be in line with the FED ‘s objectives of maintaining interest rates close to zero.
 Money supply is and will continue to increase.

As worldwide monetary supply increases, paper currencies lose value. There must something that maintains its value. The monetary base took over 200 years to rise to 800 billion dollars. Between 2008 and 2011, it rose from 800- 2.7 T. This guarantee that gold and silver will remain in a bull market fundamentally for years to come.

There is a debate that whether gold is money. Roubini, Bernanke and Buffet have publicly declared that gold is not money.

Aristotle defined five reasons why gold is money in the fourth century BC (which may only have been the first time it was put down on paper). Those five reasons are as valid today as they were then. A good form of money must be: durable, divisible, consistent, convenient, and have value in and of itself.

Gold has been used as money for millennia. If there is a crisis, people still flock to gold

Although the days of getting back to gold back currency is slim but it will always be a reference to real value of economic power – directly or indirectly

Bottomline: Gold cannot be created from thin air. It has limited supply.

Currency wars have intensified. The last of safe Haven currency is gone this week as the Swiss pegged their currency to the Euro.

2. Is Gold in a bubble?

There are many analysts that predict that gold is in a bubble. Lets examine whether gold is in a bubble.

What constitute a bubble? There is wild euphoria. Fundamentals are totally misaligned with the price. During the dot.com bubble, P/E of more than 500, and price to sales of more than 300 were common. 

It seems to me now that a lot of people are talking about gold but not many people are buying.  In a room of traders, it is normal to find only a few has invested in gold.

The number of analysts that are bearish for gold still outnumber the number of them that are bullish.

In a bubble, the typical stock market trader believed stocks were headed much, much higher — and, therefore, that any pullback should be used to buy more. In today’s gold market, in contrast, there is a remarkable level of skittishness in the gold-timer community. That is not the typical sentiment hallmark of a top of a bubble.

Gold was thought to be a bubble at 800 and then 1000, 1500 and now almost 1900.
Technically, it is overbought. Price has gone parabolic. A correction is needed. But it is not a bubble.

a. If you compare gold to various assets and the NASDAQ on the price peak in a bubble. gold has a lot to catch up.


b. Gold  is not even a mainstream investment. As a percentage, it is held in small amount by most pension and hedge funds. For hedge funds, it is only 1%. It is not a dominant investment now.

 
Eventually, gold will be in a bubble. I want to be in that bubble. It will be a maniac phase whether junior miners can go up 1000%. I want to be positioned for that day.


c. Gold reserve as a percent of monetary base  is only 20%. In 1980,  it is was 120%. 20% is close to a low.
What does it tells me that gold is in a bubble. Basically the reverse of all the above. Somehow, I like to see the monetary problems are magically solved. Also, suddenly all the deficits somehow disappeared  and there are definite solutions to the European sovereign debt crisis.


3. Supply and demand.

a. To put in perspective, there is very limited amount of physical gold available. It is said that there is enough gold only to fill an Olympic size swimming pool. There is also a lack of major discoveries.


b. Demand for gold is now higher from China and India than the Western world mainly USA and Europe.

The eastern hemisphere has a cultural affinity to gold. With increase income and growing middle class, gold purchase has increased substantially. There is more affordability.


In a price drop like today, there were massive buying of physical silver. Sprout assets management has announced that they are out of physical silver for sale. Check with many dealers, they will verify that there are massive buying on physicals especially for silver. When price drops, many sophisticated investors are buying more.

There is clearly a shortage of supply right now. 


Seasonal factors favor gold.  We have the Ramadan, the Indian New Year, Christmas and Chinese New year coming in the next 5 months.It will bought as gifts for the festivals.

Gold can be divided into the fear trade, the luxury trade and currency confidence trade.

When investors buy gold because of fall of Europe, it is a fear trade.

When investors buy gold because of fiscal policy ( increase spending and social programs ) and money policies ( increase monetary supply), it is currency confidence trade.

When investors buy gold jewellery for seasonal gifts, it is luxury trade. The luxury trade is sizeable compare to total demand. In 2010, it was 50% of demand. There are no signs that it will be lower this year looking at the way gold is being bought in China and India. Despite the 25% increase in price, demand has increase 7.5%.

It is also interest to note that when market goes up and gold goes up, it is currency confidence trade. Investors are afraid of inflation, assets dilution and currency devaluation.

When market goes down and gold goes up, it is fear trade. It is usually the results of a potential sovereign debt crisis or major banks failure.

What happens when markets goes down and gold goes down?  It is a correction and a manipulated trade.

C. Low interest rate favors gold

d. Resolution to the current debt situation and deficit.

Europe, Japan and USA are all in debt situation that will not be easily resolved.

They are all living in borrowed time. The “End Game” ( John Mauldin ) is going to be ugly

I came upon an interesting comparing US deficit situation to a typical household budget.

The market has priced in a default in Greece. Probability is 90%. There is also no solution for US debt or debt for Italy, Portugal, Japan and Spain.

History tells that before settling the deficit, it will devalue its currency before it cuts its deficit.

Upon devaluation, gold price will explode.


Gold Miners

I like to add a few comments on gold miners.

It has followed the decline of gold today. Frankly it was disappointing for me. I expected it to go up. But it was dragged down by the price of gold and the general market conditions.

There are plenty of fundamental reasons to be more bullish on gold miners than gold. There is usually a lag for gold miners to catch up with gold.

I still like gold miners main because they are cheap on valuation. Cash flow and margins are improving rapidly.


During the 1979 to 1980 gold mania, gold producers lagged the metal for 2 full years. From 1977 to 1978, gold rose 58.4%, gold stocks only up 11.7%. 

Today, gold is up YTD about 15%, and gold stock has risen only 3%.
After a 10-year bull market, good managers have finally returned to the mining sector.
Top mining companies are finally generating dramatically higher profit margins. Free cash flow is now "gushing" and will double in the next year as huge capital investments by the majors pay off.
Expect enormous consolidation as gold mining majors start buying up smaller producers, at startling premiums to current market prices.
New discoveries are expected as 10 years of new exploration is paying off, and the gains accruing to successful exploration efforts can be explosive.
I still keep 2 position size of junior gold miners. There are minimum trading activities. I re balance every 6 months or when needed. I expect when the action starts, these are going to make me the most money. Already, I went through 1 round in 2009 where I made hundreds of percent from different junior miners. Over the average, my annual return for this group is more than 30%.

Technical

So why does gold and silver corrects so violently the last 2 day. 

First, investors were expecting QE 3 and it is not obvious with the Fed announcement.It is just a change on the balance sheet.

There is a margin hike today for gold and silver effective September 25th – Monday. This reinforces my belief that these precious metals are indeed intentional suppressed and manipulated. Why hike the margin when it is falling? The objective is to drive it lower.

Also, gold has gone parabolic short term and some form of regular retracement is both normal and healthy. It happened when it was at 630 in middle 2005. 950 in Q1 2007, 1178 in beginning 2009 and now as it was on verge of exploding upwards. 
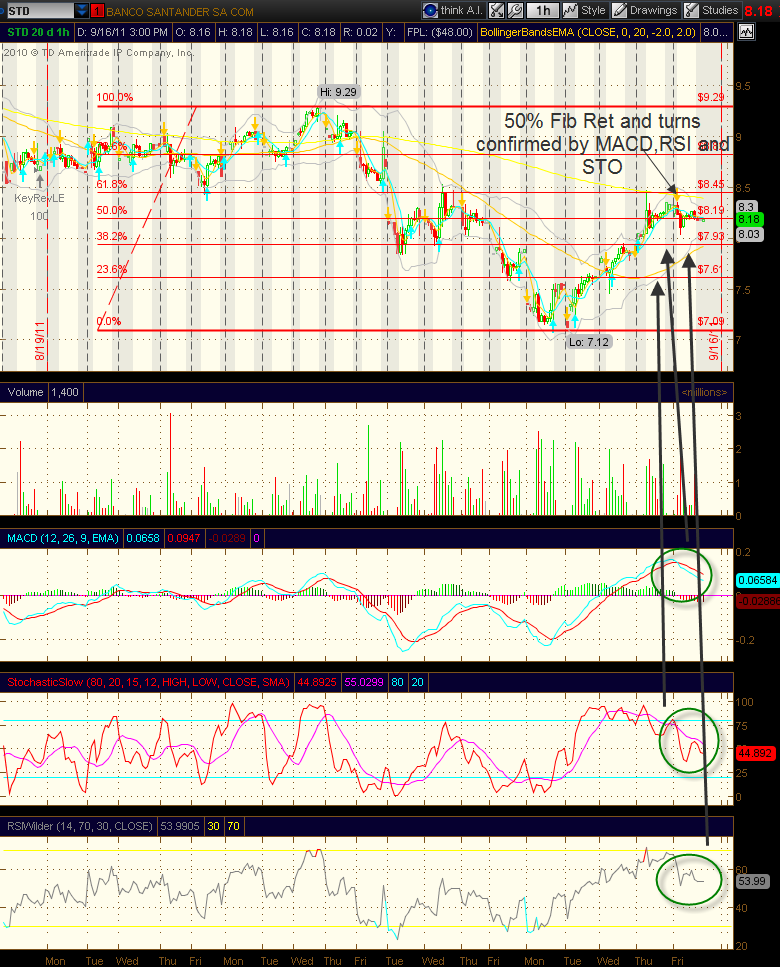
Retracement can be up to 50% and even 61.8%.

For Silver, a fall to $30 represents a retracement of 50% on a monthly chart. This is the level it may stop. If not it will move to 61.8% which is around $25. The maximum I expect it will go down is to 78.6% which is around $18. Thus technically, I am bearish until it change to align with the bullish fundamentals. It has to hold $31.

At each point, I will add to the positions but will not release the hedge until it is clearly bullish again. Meanwhile there are good trading opportunities even if it continues to fall.

Notice that the correction can be violent but it is also exuberant when it goes up. That’s why the observation of the fib retracement level is important.

Strategy

Since technically, it is bearish, I will be very cautious now with my trades until the technical situation change.

At each retracement level, I will add to my positions with covered calls and then collar once it breaks the support. Continue to add monthly SCs, Only when gold is clearly bullish, I will take off every hedge and let it run. I did in the last quarter of 2009.

Add on position at each retracement level with reversal signals. Some reversal signals at the retracement level are:;

  1. A turn on the momentum indicators at the hourly chart.
  2. A V – shape reversal with a candlestick morning star.
  3. A head and shoulder at the hourly
  4. Consolidation and break up i.e. a bull flag
Once the weekly turns negative and breaks support, add in the puts.

My positions will be increased each time it goes down. Do not add until they are definite signs of bottom and reversal. This current situation could go a bit longer and price can still go further down. But I maintain the confidence it will turn around.

The maximum is 2 X position size. From time to time, some stocks will be called out. It is a good thing as it will be profitable. I will add positions when the buy signals kick in on my system again.

Thinking back, I am experiencing the same kind of feelings during the last 4 corrections. Each time, there are intense emotions and fears. Every instead since the last 6 years, it ended up with gold going a lot higher. So maintain your faith in the metal.

The best thing now is to trade with a collar until the technical situation change. 

It is the fundamental belief that bull rage will eventually come. Just like stock when it drops, it takes the elevator down. Here if it goes up, it will shoot up like a rocket as seen with the breakout in early 2009.

Longer term, the trend has been up since 2005 and will continue to be up. I have put forth the arguments above that gold is not in a bubble.

Once the weekly chart reversed and turn positive together with momentum indicators, I will run with charts again.

My investment style is based on fundamentals. The profits are huge. I did with with the dot.com bubble and housing bubble shorting it. It was no easy feat. Now it is safer managing with collars.

Maintain the bullish bias as long as fundamentals have not changed. Currently it is overwhelming positive. But many times price direction can go in reverse to fundamentals for an extended period of time. 

Once it breaks up, there is a lot of money to be made.


Wednesday, September 21, 2011

Why I am not a day trader?

Technical systems do work for short time frame as long as it is applied consistently. Therefore it works also for a day trader. For swing trades, I use a weekly, daily and hourly time frames. If I were to day trade, it can be easily changed to daily, hourly and 15 minutes.

So it can be lucrative to be a day trader. Once in a while, you hear someone who is successful although I am not sure on the longer term performance. It  seems tempting and lucrative. One can make all the gains and close it by the end of the day without worrying about your portfolio overnight.

But only a very small minority of day traders succeed. The successful ones normally do quite well. But to get super rich, I have not seen any over longer term. On the other hand, I have seen too many end up losing everything. Big money are made over trades held longer term with clear understanding of the underlying fundamentals. Just imagine if you had bought MSFT, WMT, AAPL, Gold and BIDU in the early days and held it over time or even just trade it with a consistent positive bias over time.

A great example of day traders is the computer algorithms used by big banks with teams of highly sophisticated programmers, mathematicians and super computers. They trade by nano seconds. They have a special internet pipe to the exchange which allows them to do execute trades with such speed. They are able to front run a lot of traders by having visibility to all the trades that are submitted. The computer is able to gage the psychology of the market and trading in the specific directions.The successful rate is more than 90%.

So who am I to fight these computers?  Constantly I am thinking of how to gain an edge over them – at least not the computer but with the crowd that were victimized by the computers. Most of these are very short term traders.

I cannot be a day trader.

First it does not fit my personality. Day trades made are strictly technical. You need to get in and get out. Strict stop loss must be executed. It works strictly on probabilities. A good video gamer may be good for the job!

More important I lose my edge in trading the market. My main competitive advantages are that I understand the longer term fundamentals and I use options to hedge increasing the probability of success. With day trades, all these competitive advantages are no longer valid.

One minor disadvantage is that with a lot of trades, commission can become an important factor although we are paying dirt cheap with on line brokers.

Also, it is my belief that the shorter the time frame, the more random the price behavior and it is more susceptible to manipulation by big money.  The probability of being whipsawed is very high. Big profits are always made by holding longer term.

I do not think my technical system is robust enough to handle day trades strictly. I have mentioned my system allows for more than 50% accuracy. But with fundamental and option hedges I increase my probability to winning to 80% as long as I follow my plan. My technical system also works for longer term trades.

Day trading can be emotionally stressful and addictive. I have seen day traders skipping lunch, get emotionally charged and losing weight.  It has a similar effect like drugs. It looks great short term but long term you suffer from stress, hallucination, withdrawal and all kind of side effects.

One of my key trading objective has been to do the opposite. I am trying to reduce the number of trades.I have different accounts for longer term and short term trades.  I have verified in my account over 15 years that the account that I trade less frequently are the one that makes consistent and good profits. It seems that short term trading only fulfill the gambling instinct inside me and it is not always profitable.


Today,  Bernanke is supposed to make an important announcement. I decided  I am not going to be reactive to whatever the outcome. Many traders are anxiously waiting for the outcome and ready to jump.  Whatever happens, I should be able to adjust my portfolio to longer-term profitability observing the reaction from the market after the announcement. I make sure I do not switch on to CNBC. I will trade what I see. There is minimum stress!


Sunday, September 18, 2011

Trading process - a technical perspective

Introduction

I am adding additional detail to the post of “my trading process”. It is a significant post as I am sharing more details of my thought processes using actual trades this week.

It shows my decision process of entering a trade aligning technical with fundamentals with efforts to arrest the volatility and uncertainty of the environment.

Technical analysis has been disputed as some kind of black magic by some fundamentalist.

It is certainly not a science. But it does help to tell the short term psychological and sentiments with volumes, price movements and money flow. It is an important tool at least for my investment style.

It is not a perfect system. Many times, most reasonable technical system will work although I am not a fan of black box with mechanical process and using computer algorithms to automatically execute trade.

Discipline is key part of the system. Most system will work at least 50%. If you combine it with fundamentals and options hedging, you increase the probability of winning in a trade to 70-80%. That is also the reason I believe it is hard to be a very short term trader or day trade as you can factor in the edge you add to the trades with fundamentals and options.

No system that produce 100% or even 90% consistent success. There is a huge element of probability build into every trading process. Key is to identify information that is relevant and make decisions base of knowledge ( technical, fundamentals, sentiments ) and experience.

Premise

Below are some key premises to the trading process:


  1. Fundamental is key to long term direction of the stock
  2. Shorter term, the direction is influenced by market sentiments, crowd psychology and thus technical indicators is a necessary tool for entry and exit.
  3. The process is kept as simple as possible. There is no need to extended and highly complicated analytical tools. Most simple indicators widely available in the market will do the job nicely. The main task is to use them logically for the decision process
  4. Market swings to overbought and oversold. It gets extended inevitably from time to time. Efforts are expended to identify these tops and bottoms and ride on the swing. Having said that it is not fruitful effort to try to catch the ultimate top and bottoms
  5. Market swings has an uncanny conformation to certain wave patterns. Fibonacci Retracement ( Fib Ret ) is my favorite. It works pretty consistent. But I find Elliot Wave too subjective and thus use it only sparingly. I will elaborate on this with examples later.
  6. My key objective of the trade are:
-        Maximize gains or risk to reward ratio
-        Attempt to ride on the short to medium term swing as much as possible. At the same time, I want to stay on position that I am very bullish fundamentally without missing the big gains.
-        Minimize loss with risk control using options, good entry
-        Enhance the probability edge with options and fundamental background for the trade

  1. Always trade with a plan. Many traders enter trades in reaction to a news, rumors or comments from friends and analysis resulting in over trading. Do not force into a trade rather wait for a trade to come to you. There must be technical and fundamental basis for entry the trade. Profit targets and time frame are identified. Primary exit and secondary exit are set. Also, it takes a lot of psychological and emotional fortitude or discipline to ensure that you execute the secondary exit. SE is a form of defense and risk control.
  2. Trade in the direction of the trend. The trend is your friend. Trade what you see. Often the fundamental and technical can be totally misaligned.
Primary Technical Tools

Listed below are some primary tools used in the technical analysis:

For Trend and momentum directions

-        Moving averages : I use 20, 50 and 200 MA
-        Momentum indicators
o       slow stochastic
o       RSI
o       MACD
o       Volume
-        Candlesticks for directions and most often for reversal signals
-        Multiple time frame


Pattern Analysis

-        Fibonacci Retracement / Elliot wave
-        Classical patterns : saucer, head and shoulder ( or reverse ), double top, bull and bear flag
-        Support / resistance
-        Trend lines
-        Decide whether the trade is in a continuation, reversal or consolidation phase.

Options

-        Implied volatility
-        Spreads and open interest
-        Call / put and put /Call ratios

Most of these indicators are built into my charts. I have a weekly, daily and hour charts for comparison. I shall show how all the tools are used for the decision process using examples from this week trades in a logical and systematic fashion.

As with all traders, there will be mistakes. There will also be losses. Constant attempts are made to ensure losses are kept small. This is a very important part of the trading process. At the same time, I try to let winners run. Using options helps greatly in the risk control processes. It also helps to cushion the volatility.

This could be one way to deal to with all the big computer algorithm high frequency trade (HFT). Using a longer time frames and options to cushion the volatility. Day traders are especially vulnerable to the short term big swings which is becoming more frequent because of HFT.


Order of analysis

  1. Determine the fundamental basis for the trade. Align it with the overall market directions. If the overall market is bullish, I will be more bullish bias on trades and vice versa. Fundamental will be the key driver of the direction of a trade LONG term. I have seen it too many times during the Asian crisis, dot.com bubble, credit crisis in 2008 and currently the sovereign debt crisis. It will pay off big time.
If you were able also to latch on the fundamental of such as AAPL, BIDU and Gold, you will be rewarded multiple folds.

Often you may be right fundamentally, the stock can go against you up to 50%, 61.8% and 78.6%. I will elaborate on this later in some examples. The key is to identify the reversal at the right time frame.

Trade in the fundamental direction will yield a much higher reward. It gives a very important edge.

Once the fundamental direction is determined, start the technical analysis. Move on with the next order of analysis

  1. Determine the Trend
    1. Use multiple time frames to determine the trend. Examples
                                                    i.     If the weekly is bullish, it means  the stock will be up for a few week.
                                                   ii.     If weekly bullish and oversold, a longer term top is near. Daily calls for direction over the next few days and hourly for the direction in the next few hours.
                                                 iii.     If the stock is in the overbought or sold, there will be limited upside an downside to the price
                                                  iv.     Trade in the direction of the longer time frame. Align the short time frame with the longer time frame. If it is weekly bullish, enter the trade upon a daily bullish reversal. 

    1. Use trend lines / support and resistance
                                                    i.     Draw  the trend lines.
                                                   ii.     Identify another cycles of ups and downs in times of time if any.
                                                 iii.     Draw the support and resistance lines
                                                  iv.     Determine current direction is an impulse move ( strong direction ) or just a corrective move ( a relief rally or temporary correction). In other words, determine where it is in a continuation, reversal or consolidation phase.


  1. Identify the pattern
-        Pattern analysis is used to identify the phase of the trend. Commonly used technique to do this is Elliot wave. But I feel that it is too subjective. Often, when it is wrong, Elliot Wave technicians will explain it with wave extension, complex wave, irregular waves! I am usually confused. Probably, I am not an expert in this area.

-        I have seen Bob Prechter, a major practitioner of Elliot wave has been wrong for so many years. If you follow Bob in 2000, where he forecasted gold to go down, a period of deflationary pressure, civil riots and a depression, you would have missed the run on the stock market from 2002 to 2006. You may say he is too early but he clearly expected the events to happen in 2003-2006 which happen to be a mini boom because of Greenspan loose monetary policies.

-        However, there are uses for Elliot wave at times although it is subjective. Just do not try to be too precise and wait for confirmation. I use Elliot wave simple to determine whether current phase is impulse or corrective. Also, I can roughly use it to determine a potential top or bottom. Roughly, I try to determine whether it is wave 1-5 or A-C. 

-        Classical patterns can be also used to decide whether there is a possible breakdown or reversal. It is important to note that classical patterns always need confirmation. Also, this can be subjective but it is certainly clearer than Elliot Waves.  Example:  a head and shoulder is not valid until its neckline is broken. Often it is a still a lagging signal.

-        Momentum indicators ( Stochastics, MACD  and RSI ) will give confirmation on the patterns whether there is a breakout, a change of trends. Keep in mind that momentum indicators are very short term. It is used only in line once the trend and patterns are established.

-        The combination of classical patterns with Fibonacci retracement, candlesticks reversals signals, multiple time frame, momemtum indicators and a “subjective” view of Elliot wave will give me a powerful idea of potential reversals. It will be even better if there is volume confirmation.

At this stage, it sounds mumbo jumbo. I hope it will be cleaerr once I give examples of some of the trades I made this week. Also, I believe that over time with more examples I will be able to improve and be clearer on the process.

From the above process, I construct a portfolio of longs and shorts from my watch list. It depends on the market sentiments. If it is bearish bias the longs will overweigh shorts. The reverse will apply if the overall market is bullish bias. Bias of the market is determined from the analysis of the broad indices. Currently, the QQQ has broken its short term bearish trends and thus it is time to add more longs to technology counters.

Options are used to hedge the trades. Bullish trades are hedged bycovered calls and dynamic collars. Bearish trades are hedged by synthetic puts,covered puts and reversed collars.

Stocks are entered on an individual basis based on their directions, fundamentals and relative strengths to the index. It is interesting to note that even in bull market there are always stock that can be shorted. Also, in a bearish market there are bullish trades.

Presto! You have now a hedged and diversified portfolio. To me, this is superior to many of the diversification processes generally taught and also hedging using SPX puts, or inverse ETFs. The only set back is that this requires some maintenance.

Practical Applications

I am going to give a few examples using some of my actual trades executed in the  last 2 weeks.  I entered a number of trades. Only 1 of them needs adjustment so far. I will go into details a few including the one that I need adjustment and exercise my secondary exit.

STD

Fundamental:  Europe is in a crisis.  Problem in Greece is not going to be easily resolved in the near future. Problems should continue to escalate until some real change has incurred not just politician coming out to reassure the market.

This crisis is dangerously similar to 2008 where Lehman’s CEO and Bernanke came  out to reassure the market that everything was fine. The market collapsed a few weeks later.

Technical: Stock has dropped almost 30% in about one month and rallied from $7.15 to 8.26 in 4-5 days. I expect this rally to be short lived.

How do I watch out for the reversal?


First price hit the upper channel resistance on the daily chart. Although the MACD and RSI are showing signs of positive turn, the overall directions of all the oscillators ( MACD, STO and RSI ) are down

More important, is the hourly chart.  When it hits the retracement of 50%, I started to watch it very closely. When the MACD, RSI and STO turned negative I initiated the trade.


  1. Trend – it is down. Weekly oscillator is definitely down with no signs of recovery.
  2. Daily timeframe : it is bearish as long as it is not breaking the channel
  3. Hourly: At 50% retracement, it is a common Fibonacci retracement level. Sometimes it goes to 61.8% and 78.6% maximum. At 50% the oscillator turn, the trade was initiated. It was actually executed when I was exercising in the gym. When I was back, I was actually losing a little money. Immediately, I initiated the SP option.


Trade:

Sell  1000 STD at 8.2
Sell  Dec 7 SP at 0.65.

PE : Let the Dec 7 SP goes ITM and be assigned. ROI : 22.4 % for 3 months.

SE: If stock goes above 9, bull a long call and roll up the SP to 8.


So far the trade is going in my favor. I could be wrong. Over the weekend there is the European Ministerial meetings. They may come out with a huge bold bailout for Greece and all the countries in trouble. But the probability of a long term solution is low. If I am wrong, I will exercise my secondary exit and will continue to manage the trade to lower profitability or a slight loss. This will be illustrated with my trade on CRM

Earlier in the week when the European banks were falling, a trader in Vancouver asked whether I should add to my shorts. I told him to wait although I was bearish as it was greatly oversold.On Friday, I added on to my shorts.


CRM

With the depressing market recently, I am targeting many of the stocks with very high market valuation. These will be the stocks that will fall most in a bear market. NFLX is already one of the victims. So I shorted, LNKD, PCLN, GMCR and CRM. I am negative on all of them because of the high valuation. I cannot understand how LNKD can have a PE of over 1200 and a coffee shop seller has a PE of over 105. These are bubbles that will burst on a negative turn on the market

On Tuesday, everything seems to be falling apart. CRM hourly shows signs of breaking down.

Price on daily chart seems to be hitting resistance.

The signals I ignored on the weekly was MACD and STO were very positive. Weekly charts were negative.

On Tuesday, Sept 13th I shorted CRM at 124.

Also, sell a Oct 115 SP at 5,12.

My primary exit is to let the SP be assigned.

My SE is to add a short call when it hits 128 and show signs of breaking up.

On Sept 15, when CRM hits 129, I exercised my SE. QQQ turned short-term positive too on Wednesday.

I bought a Nov 135 C and roll the Oct 115 SP to Oct 120 SP reducing the cost of my short.

Longer term, this trade is still very manageable. It is my belief that I will exit the trade with a small profit or just a minor loss. Currently, the stock is very much over bought. It will probably go up to 140 and I shall monitor the overall market to see if it turns long term positive. If so, I will need to reverse my bias for this position from negative to positive. This can be accomplished safely through just adjusting the options.

All the other shorts are doing fine. You can see the PCLN, GMCR and LNKD are showing negative technical signs - hitting resistance, negative on daily and hourly, etc.  Unless the market sentiment changes substantially positive, I should make money from all these trades.

Bullish trades

I bought HD, SINA, AAPL, BMC and AMZN in the middle of the week as the Nasdaq turned positive.  I shall not elaborate on all these trades. Try going through the charts on the multiple time frames, patterns, and trend lines, you should be able to get similar results. The SE should be easily determined. 

Also, I bought quite a few shares on the miners on Thursday - GDX, AUY and GG. Also on Thursday I rolled my calls on SLW which went ITM. The decision was made by a very consistent process.  It was a very interesting signal which I shall elaborate when I have time.

So far, no adjustment needs. I should be able to end positively on all these positions.

Concluding remarks

I will continue to illustrate these further using the same technical methodology and trading process when I enter the trades on the blog.

It is getting late now on Sunday now. I guess I need to retire now to get ready for an interesting day tomorrow.


Visitors to this blog

About Me

An engineer by training graduated with B.Sc (hons) and MBA from Strathclyde university in Glasgow, Scotland. Started as an engineer in R&D for 3 years with Philips. Then, worked with DuPont for 13 years. Last job was VP, Marketing for Asia Pacific. Left to start a number of companies in various segments which include a large electronic distribution, a VoIP provider, an internet trading portal in Australia,and an executive training consultancy firm. Have listed companies in NYSE, Australia Stock Exchange, Singapore Stock Exchange Main Board. I was on the Board of Directors for 1 company listed in Thailand, 1 in Singapore and 1 in Australia. Was in the senior management of a company listed in NYSE. Still holding major share positions in the VoIP and Executive training companies. Both are private companies.

Disclaimer

These articles merely reflect the opinions of this author and are by no means a guarantee of future economic conditions, market or stock performance. Though the author strives to provide accurate and relevant data, he sometimes relies on external sources and cannot assure the reader of the accuracy of these external sources. Additionally, these articles are provided for INFORMATIONAL PURPOSES ONLY and are NOT MEANT to provide investment advice to anyone. For investment advice, please consult your professional adviser.